

Employment across Switzerland grew in the first half of 2026. Household employment moved sharply in the other direction. Federal Statistical Office estimates show an average of 66,902 employed people, down from 75,480 one year earlier. The 11.4 percent fall was the largest among 19 published industry groups. Women accounted for 93.9 percent of the estimated net decline. Their employment estimate fell 13.9 percent, compared with 3.0 percent for men.
The decline was concentrated among women
The average for women fell from 57,966 to 49,911, a decrease of about 8,100. The average for men fell from 17,514 to 16,991, a decrease of about 500. Almost 94 percent of the estimated net change was therefore among women.
The figures show how the estimated decline divides by sex, but not why it happened. The unanswered question is now clear: why is employment in this household category falling much faster than employment overall, and why is the change so heavily concentrated among women?
Employment estimates for women and men
First half averages. Every bar uses the same zero and the same scale.
Women
−13.9%Men
−3.0%The question now before the Federal Council
A submitted parliamentary question asks the Federal Council why fewer household employers are using the simplified payroll procedure and whether registration and payroll administration can be made easier across cantons. It also asks about household-specific measures in the proposed revision of the law on undeclared work. Separately, the Federal Council’s consultation on that revision runs until 16 October 2026.
We hope this decline does not mean that more household work is being done undeclared. Legal employment needs to be simple and affordable, so Helpers keep the protections they are entitled to.
Gilberto de la Fuente, Director at Helpore
| Measure | 2025 | 2026 | Change |
|---|---|---|---|
| Household employment | 75,480 | 66,902 | −11.4% |
| Women in household employment | 57,966 | 49,911 | −13.9% |
| Men in household employment | 17,514 | 16,991 | −3.0% |
| Employment across Switzerland | 5,352,556 | 5,378,452 | +0.5% |
Figures are arithmetic means of the first and second quarter estimates, not six month sums.
The largest fall in the table
Across all economic activities, the estimated number of employed people rose by 0.5 percent, from 5,352,556 to 5,378,452. Household employment fell by about 8,600 people over the same period. Information and communication had the next largest fall, 3.3 percent.
The headline fall was more than three times the rate of the next declining group while the national total moved upwards.
Households, the next industry fall and Switzerland
First half of 2025 compared with the first half of 2026. T and J are NOGA industry groups. Switzerland is the national total, not an industry group. Percentages are rounded to one decimal.
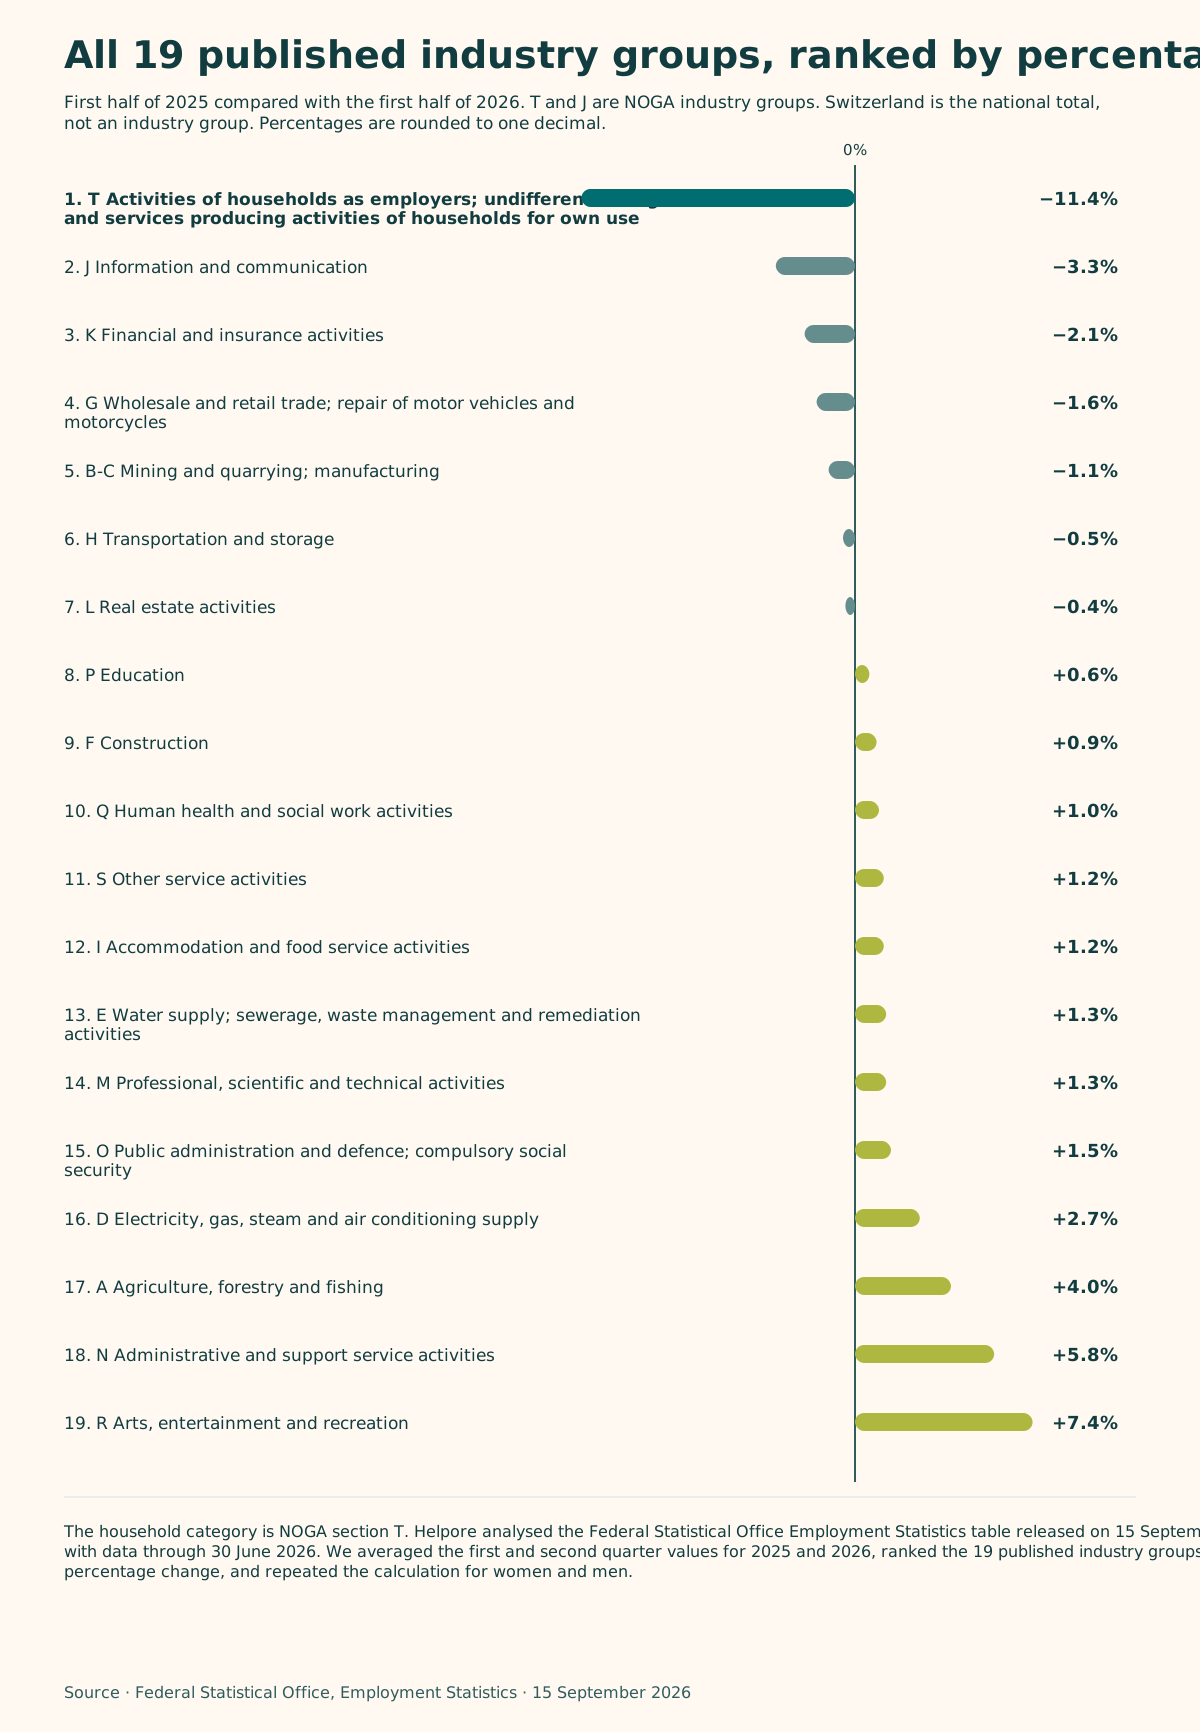
| Rank | Official NOGA section name | Change |
|---|---|---|
| 1 | T Activities of households as employers; undifferentiated goods and services producing activities of households for own use | −11.4% |
| 2 | J Information and communication | −3.3% |
| 3 | K Financial and insurance activities | −2.1% |
| 4 | G Wholesale and retail trade; repair of motor vehicles and motorcycles | −1.6% |
| 5 | B-C Mining and quarrying; manufacturing | −1.1% |
| 6 | H Transportation and storage | −0.5% |
| 7 | L Real estate activities | −0.4% |
| 8 | P Education | +0.6% |
| 9 | F Construction | +0.9% |
| 10 | Q Human health and social work activities | +1.0% |
| 11 | S Other service activities | +1.2% |
| 12 | I Accommodation and food service activities | +1.2% |
| 13 | E Water supply; sewerage, waste management and remediation activities | +1.3% |
| 14 | M Professional, scientific and technical activities | +1.3% |
| 15 | O Public administration and defence; compulsory social security | +1.5% |
| 16 | D Electricity, gas, steam and air conditioning supply | +2.7% |
| 17 | A Agriculture, forestry and fishing | +4.0% |
| 18 | N Administrative and support service activities | +5.8% |
| 19 | R Arts, entertainment and recreation | +7.4% |
The pattern lasted seven quarters
This was not a single weak quarter. The first half estimate was 81,365 in 2024, 75,480 in 2025 and 66,902 in 2026. From the fourth quarter of 2024 through the second quarter of 2026, every quarter was below the same quarter one year earlier.
The latest quarter was 4.5 percent below the second quarter of 2025. Seven consecutive year on year declines make the result a sustained pattern, even though the total did not fall between every adjoining quarter.
Method and source
The household category is NOGA section T. Helpore analysed the Federal Statistical Office Employment Statistics table released on 15 September 2026, with data through 30 June 2026. We averaged the first and second quarter values for 2025 and 2026, ranked the 19 published industry groups by percentage change, and repeated the calculation for women and men.
The source reports average numbers of employed people under the domestic concept, not registered households, positions or hours, and provides no confidence intervals. The analysis therefore describes the estimate without claiming statistical significance, individual job transitions or a cause.