Professional home care in Europe
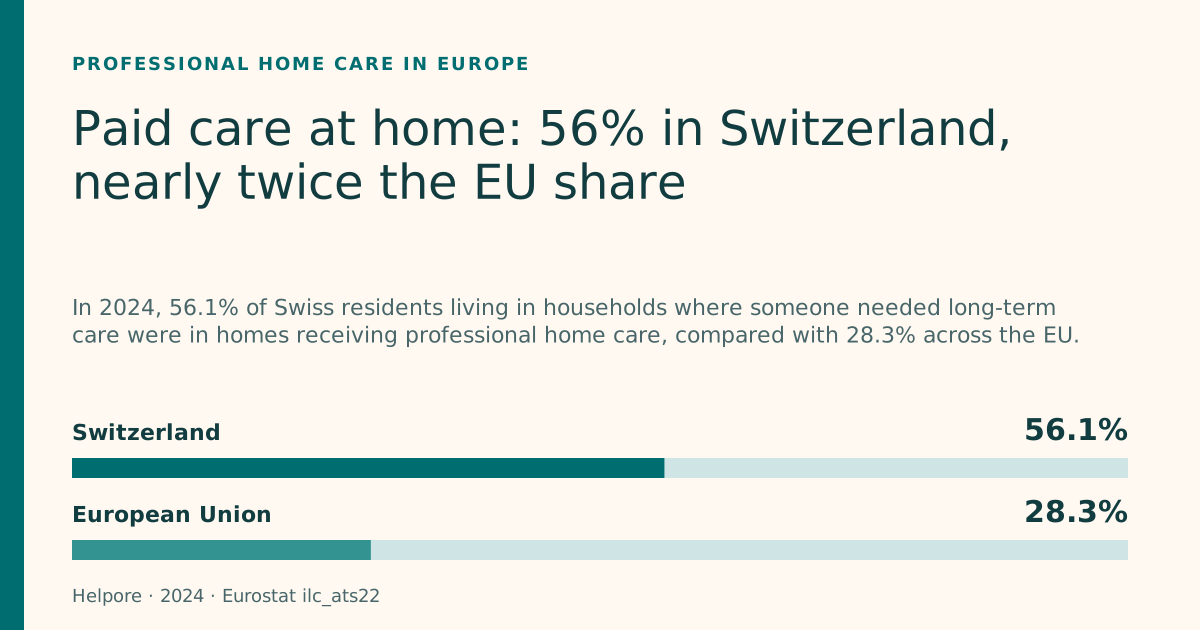
Paid care at home: 56% in Switzerland, nearly twice the EU share
In 2024, 56.1% of Swiss residents living in households where someone needed long-term care were in homes receiving professional home care, compared with 28.3% across the EU.
2024 data Eurostat living conditions report, September 2026
Explore the country mapA difference of 27.8 percentage points.
What the measure means
What counts as paid care at home?
Eurostat defines professional home care as care provided as a job or paid activity.
Is paid care at home less common below the low-income threshold?
Among Swiss residents in households where someone needed long-term care, the estimated share living in households receiving professional home care was approximately 47% below the relative low-income threshold and 58% above it.
The care figures are for 2024. Income from 2023 is used only to classify residents below or above the relative low-income threshold, set at 60% of median equivalised disposable income. The percentages are approximate calculations from rounded cells.
The debate in Lucerne
What is Lucerne’s parliament debating about care at home in October 2026?
Family care, oversight and home care tariffs are on Lucerne’s October parliamentary agenda. The map below opens on Switzerland.
European context
Explore 34 available country values
Select a country to compare its 2024 share with the EU value. The map shows the 34 countries with available source values.
Select a country with the menu, pointer, or keyboard. On the map, use the arrow keys to move between available countries and Enter or Space to select.
Small-country shortcuts
View all 34 available country values
All available country values
| Country | Share | Compared with the EU | Source note |
|---|---|---|---|
| Albania | 9.0% | −19.3 percentage points | No source flag |
| Austria | 22.4% | −5.9 percentage points | No source flag |
| Belgium | 52.9% | +24.6 percentage points | No source flag |
| Bulgaria | 10.9% | −17.4 percentage points | No source flag |
| Croatia | 27.4% | −0.9 percentage points | No source flag |
| Cyprus | 62.9% | +34.6 percentage points | No source flag |
| Czechia | 22.9% | −5.4 percentage points | No source flag |
| Denmark | 63.5% | +35.2 percentage points | No source flag |
| Estonia | 7.6% | −20.7 percentage points | No source flag |
| Finland | 39.3% | +11.0 percentage points | No source flag |
| France | 46.3% | +18.0 percentage points | No source flag |
| Germany | 29.2% | +0.9 percentage points | No source flag |
| Greece | 16.0% | −12.3 percentage points | No source flag |
| Hungary | 8.3% | −20.0 percentage points | No source flag |
| Ireland | 24.7% | −3.6 percentage points | No source flag |
| Italy | 28.2% | −0.1 percentage points | Low reliability |
| Latvia | 21.8% | −6.5 percentage points | No source flag |
| Lithuania | 31.0% | +2.7 percentage points | Provisional |
| Luxembourg | 28.2% | −0.1 percentage points | No source flag |
| Malta | 23.1% | −5.2 percentage points | Low reliability |
| Montenegro | 17.9% | −10.4 percentage points | Low reliability |
| Netherlands | 44.4% | +16.1 percentage points | No source flag |
| North Macedonia | 11.6% | −16.7 percentage points | No source flag |
| Norway | 34.7% | +6.4 percentage points | Low reliability |
| Poland | 8.5% | −19.8 percentage points | No source flag |
| Portugal | 49.9% | +21.6 percentage points | No source flag |
| Romania | 10.4% | −17.9 percentage points | No source flag |
| Serbia | 16.3% | −12.0 percentage points | No source flag |
| Slovakia | 28.3% | 0.0 percentage points | No source flag |
| Slovenia | 42.3% | +14.0 percentage points | No source flag |
| Spain | 20.8% | −7.5 percentage points | No source flag |
| Sweden | 22.4% | −5.9 percentage points | No source flag |
| Switzerland | 56.1% | +27.8 percentage points | No source flag |
| Türkiye | 10.6% | −17.7 percentage points | No source flag |
Method and sources
How to read the figures
The direct comparison uses 2024 Eurostat ilc_ats22 data.
The Swiss income comparison uses Eurostat’s ilc_ats19 table. Below the threshold, 2.5 is the share of the income group living in households with professional home care and 2.8 is the share living in households where someone needed long-term care but received no professional home care. Above the threshold, the corresponding shares are 2.1 and 1.5. The calculations are 2.5 ÷ (2.5 + 2.8) and 2.1 ÷ (2.1 + 1.5), from cells rounded to one decimal place.
Percentages classify residents by household situation, not individual recipients or household counts.
Sampling uncertainty is not provided.
These data do not establish significance, unmet need, affordability, cause, policy effects, trends or care quality.